My software notes

July 28, 2011

[PyMOL] DNA–example II

Filed under: pymol/ molmol — kpwu @ 6:09 pm
Tags: ,

Follow up previous post, here shows several modes available in PyMOL to display the ribbon/chain of DNA/RNA.

Example molecule: B-form DNA PDB code:  2L8Q

Running version, PyMOL 1.3 (x11 version on MacOS 10.6)

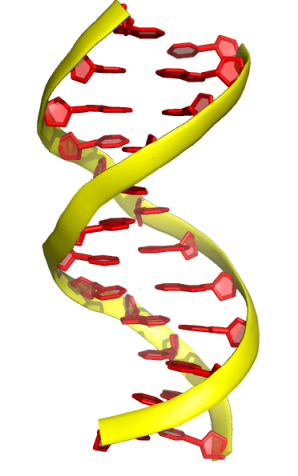
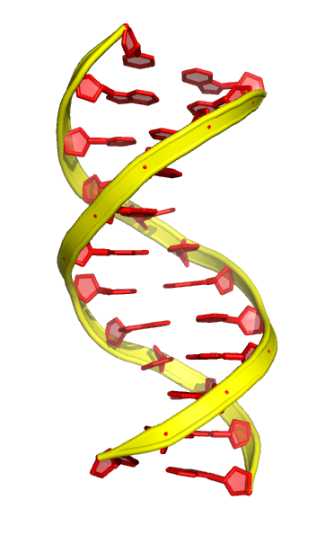
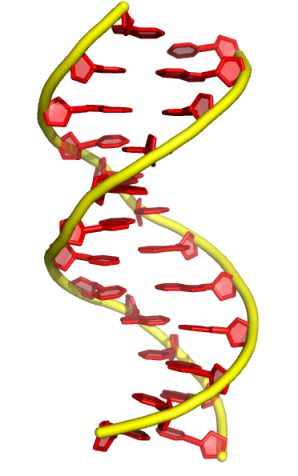
The previous version use “oval” to show the ribbon of DNA. Here are some other ways to show the ribbon:

1. default ribbon shown by cartoon (“tube” mode)
default radius of tube mode

set cartoon_tube_radius, 1

2.  The  “oval” mode

cartoon oval
set cartoon_oval_width, 0.3
set cartoon_oval_length, 1.2

3. The “rect” mode:

cartoon rect
set cartoon rect_width, 0.5
set cartoon rect_length, 2

combined with addition command (molecule rotated):

cartoon arrow

4. The “dumbbell” mode:

cartoon dumbbell,
set cartoon_dumbbell_width, 0.3
set cartoon_dumbbell_length, 1
set cartoon_dumbbell_radius, 0.35

In most protein structures shown in papers, the helices and sheets are always colored in two colors. We can use “cartoon_highlight_color” to create such effect on DNA,too. Here is the example:

set cartoon_highlight_color, navy
set cartoon_nucleic_acid_color, palecyan

2012 May 24, new post about different colors for the rings.
July 26, 2011

[PyMOL] example of DNA

Filed under: pymol/ molmol — kpwu @ 4:41 pm
Tags: ,

Several private emails request me to show some examples of DNA/RNA using PyMOL. I am not familiar with commands related to nucleic acids in PyMOL because I never have chance to study DNA/RNA. I made some posts few years ago just for fun.

Here is a step-by-step re-cap I make followed by my old post.

PyMOL: 1.3 on Mac OS 10.6.5

DNA template: PDB code 2L8Q

beginning point: using “default cartoon” to show the duplex B-form DNA

set cartoon_nucleic_acid_color, yellow
cartoon oval

set cartoon_ring_mode, 1
set cartoon_nucleic_acid_mode, 0
set cartoon_ring_color, red
set cartoon_ring_transparency, 0.5

set cartoon_oval_length, 1.6
set cartoon_oval_width, 0.8
set cartoon_ring_width, 0.5

set ray_trace_fog,0
ray

set ray_trace_fog, 1
set ray_trace_mode,2
ray

turn on “surface”
set surface_color, white
set transparency, 0.35

Differences of “cartoon_nucleic_acid_mode” are shown at here.

July 9, 2011

[PyMOL] use of “ray_trace_mode”

Filed under: pymol/ molmol — kpwu @ 9:20 pm
Tags: , ,

I do like a command called “ray_trace_mode” in PyMOL because different modes can generate different light and color effects on the structure I want to express to readers/students. Here is a quick examples of the effect on different modes.

The structure I use at here is LolA which PDB code is 1UA8.

1. ray_trace_mode 0 ( at pymol terminal, type “set ray_trace_mode 0”)

2. ray_trace_mode 1 ( at pymol terminal, type “set ray_trace_mode 1”)

3. ray_trace_mode 2 ( at pymol terminal, type “set ray_trace_mode 2”)

4. ray_trace_mode 3 ( at pymol terminal, type “set ray_trace_mode 3”)

5. ray_trace_mode 4 ( at pymol terminal, type “set ray_trace_mode 4”)

July 5, 2011

[software] MaxCluster

Filed under: softwares and scripts — kpwu @ 10:42 am
Tags: , ,

I was searching online for some scripts/macros that I can use them to superimpose and compare the RMSD of two proteins (same sequence) based on my calculated results. I know PyMOL and MOLMOL provide such tools however I have tons of protein candidates to be compared.

Before I start to write the script by myself, I checked online and saw this software “MaxCluster” developed by the “Structural Bioinformatics group in Imperial College London” . This program can do all atom or backbone RMSD calculation (superposition/alignment too) as well as ensemble clustering. It works pretty FAST!! I used many times recently. To compare more than 3000 structures, it returns me the results in one minutes.

Good for try.


Blog at WordPress.com.