My software notes

December 14, 2020

New blog site

Filed under: Uncategorized — kpwu @ 11:01 pm

Since I began my independent research position in Taiwan in 2018. I built a new blog site at kpwulab.wordpress.com and this blog will no longer provides new articles, software notes or any updates.

Please go to the new blog site for new PyMOL and any software notes I post.

Thank you.

May 2, 2013

[PyMOL] molmol-like colors on secondary structural elements

Filed under: pymol/ molmol — kpwu @ 9:18 pm
Tags: ,

I  recently saw some nice presentations of protein structures prepared by MOLMOL. Since MOLMOL is not actively maintained,  I wonder how to make similar colors on the secondary structural elements in PyMOL.

In this short blog,  an example is shown. The top and bottom figures  are made by PyMOL and MOLMOL, respectively.

How I did that? Basically, just make highlight color yellow, turn on discrete cartoon color, adjust the width and length of strands.

The PyMOL script is shown here, too:

cmd.show_as(“cartoon” ,”all”)
bg_color white
set cartoon_highlight_color, yellow
set cartoon_rect_width, 0.03
set cartoon_rect_length, 1.7
set cartoon_discrete_colors, on
util.cbss(“all”,”red”,”cyan”,”gray70″,_self=cmd)

2H28-molmol like

x

April 6, 2013

[PyMOL] compute molecular weight

Filed under: pymol/ molmol — kpwu @ 3:06 am
Tags:

From PyMOL 1.5, there is a quick way to compute the object molecular weight.

Simple click “A” right next to the (select) object, and go down to “compute”, then choose “molecular weight” to calculate MW of object either “explicit” or “with missing hydrogens” mode. The missing hydrogens mode means PyMOL automatically add missed protons of object and calculate the proton-added MW.

I found that object with water oxygens (commonly in crystal structures) will also be included while running this command. Users may need to be careful about it.

Note: The calculated MW is actually a bit different from values (same sequences, of course!) I used “protein calculator” or “ExPASy get pI/Mw“. The value from PyMOL are not average/monoisotopic MW as calculated from both two sites (both two sites gave me exact same numbers). I actually don’t know why..

Here is the snapshot. The computed MW can be seen in the pymol terminal (boxed). Top number includes missing hydrogens.

computeMW

Morphing movie using RigiMOL/PyMOL

Filed under: pymol/ molmol — kpwu @ 2:14 am
Tags: , ,

RigiMOL is a feature only available in incentive PyMOL, not in open source built PyMOL.

The following two short (very short) youtube videos are made by the example script provided at PyMOLWiki (script link at here).

The demo script is also pasted at here:

====================================

# get open and closed conformation of adenylate kinase

fetch 1ake 4ake, async=0

# make two state object

align 1ake and chain A, 4ake and chain A, cycles=0, object=aln

create rin, 1ake and aln, 1, 1

create rin, 4ake and aln, 1, 2

# morph from epymol

import rigimol rigimol.morph(“rin”, “rout”) 

======================================
Notes:

1. Steps, length of movie and resolution are tunable. I just show the movies using default (above) script.

2. Once the rout is made, movie can be save easily using “file -> save movie as”

3. I used MacPyMOL to made the two movies.

Cartoon mode

Ball and stick mode

November 6, 2012

[Modeller] point mutation script

Filed under: softwares and scripts — kpwu @ 10:41 pm
Tags: , ,

Saw a script provided by Modeller that can quickly mutate a point to any other residues.

Here is the linke <Mutate model python script by Modeller>

To use the script, just type command like the following line:
Example: python mutate_model.py 1t29 1699 LEU A > 1t29.log

Where mutate_model.py is the script provided by Modeller
1t29 is the PDB file name
1699 is the position for mutation
LEU is the new residue
A stands for chain number.

I have test this script at Modeller 9v11, it works very well and quickly.

September 18, 2012

[PyMOL] side-by-side comparison of 3 electrostatic surface potentials

Filed under: pymol/ molmol — kpwu @ 2:22 am
Tags: , , , ,

Here is an example using “grid mode” provided in PyMOL to show the charged states of a protein (PDB entry: 1Z66) at pH 4 (left), 7 (center) and 11 (right).  PyMOL script is attached after the figure.
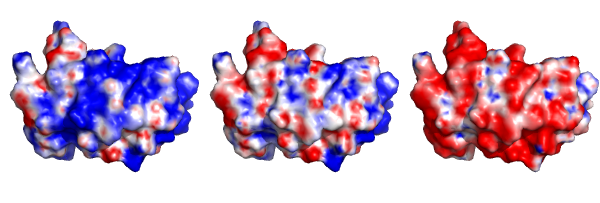
First,  the potential maps at three pH states have to be generated. I used APBS web server combined with PROPKA to get  calculated pH-dependent potentials (.dx files).

Then I load 1z66.pdb and load all 3 .dx files. Draw first protein with one of the potentials. After that, turn on the grid mode and then duplicate pdb object twice.

Last, assign the potentials to duplicated objects. The electrostatic surface views at 3 pH states can be shown easily!

I really like the grid mode in PyMOL!  No need to use any image editor to assemble 3 potential views. No worry of sizes of molecules if generated separately.

Tips of “grid mode” can be found in my earlier post: [PyMOL] grid mode.

Steps to “Draw the electrostatic surface” can be checked at my earlier post, too.

=======pymol log.pml =================

load 1z66.pdb
load 1z66-pH4.dx, emap_pH4
load 1z66-pH7.dx, emap_pH7
load 1z66-pH11.dx, emap_pH11
set grid_mode, on
cmd.show_as(“surface” ,”1z66″)
ramp_new elvl1, emap_pH4, [-5,0,5]
set surface_color, elvl1, 1z66,
cmd.disable(‘elvl1’)
cmd.create(None,”1z66″)
ramp_new elvl2, emap_pH7, [-5,0,5]
set surface_color, elvl2, obj01,
cmd.create(None,”1z66″)
ramp_new elvl3, emap_pH11, [-5,0,5]
set surface_color, elvl3, obj02,
cmd.disable(‘elvl3’)
cmd.disable(‘elvl2’)
bg_color white
ray 600
png 1z66.png

September 11, 2012

[PyMOL] customize spectrum colors

Filed under: pymol/ molmol — kpwu @ 12:29 am
Tags: ,

Saw a post at recent Pymol mailing list and found the nice example of “spectrumany” at PymolWiki.

Here is the example I created using “spectrumany” to show customized spectral colors of the example protein TBEV envelope protein “PDBV entry: 1SVB”.

By using the built-in command “spectrum”, one can color the envelope protein in 2 or 3 gradient colors or use the “rainbow” to colorful gradient.

The figure below was drew using command “spectrum count, red_white_blue, all“. (more pymol built-in color schemes are listed at my older post: [pymol] example– coloring surface by b-factor).

After downloding “spectrumany.py” and run “spectrumany.py”, one can customize gradient colors on his/her target. The example shown at here using command: “spectrumany count, red green blue yellow white, resi 1-395“.

In this pymol script, colors are separated by “space”. For example: red blue cyan white yellow

Note: In a lot of crystal protein structure PDB files, there are a lot of water molecules as well as some heavy metal ions. I found that using “spectrumany count, red green blue yellow white, all” will result in the image below.

All water molecules are colored in white not not shown in the image. The reasons are 1) water are numbered after 400 (421-800) and 2). water H2O is not shown in cartoon mode. When water molecules are presented in “sphere” mode, you can see the water molecules are colored from yellow to white.  In order to make right color gradient schemes (in cartoon mode) either using pymol-provided “spectrum” or the “spectrumany.py” script, it better to define the residue ranges (resi xxx-yyy) not use “all”.

August 26, 2012

[PyMOL] grid mode

Filed under: pymol/ molmol — kpwu @ 2:43 pm
Tags: ,

It is often that we compare different proteins and want to show all aligned proteins in one time.

One popular way shown in scientific papers is to superimpose all structures, however it shows an overlapped “tangle”.  Sometimes such way doesn’t provide a good view for reader.

I am going to show you the “grid_mode” provided in PyMOL. It’s quite useful for PyMOL users to generate high quality “well-aligned” proteins in grid mode.

First,  I load all proteins I want to compare. At here I use the envelope protein domain III from yellow fever virus (Dengue virus,  West Nile virus, Japanese Encephalitis virus and tick-borne Langat virus).

Then I use “alignto” command to align all structures to “1PJW” and remove all other un-used chains.

Then, I turn on the grid mode by typing in “set grid_mode, 1“. The PyMOL viewer instantly aligns the 4 proteins in 2×2 grid.

Since the 4 proteins are first aligned by “alignto” command and then are separated to grids, I can move and rotate them at one time.

In addition to the 2×2 grid,  I also find that 4 proteins can be separated in 4×1 (one raw) way when I expand the window width of “Pymol viewer”.

I frequently see some 2×2 “detailed views” of proteins in papers. I always thought that the author must generate individual figures and then assemble those figures by photoshop or other image editors. I found that PyMOL grid_mode can generate such 2×2 detail view quickly. I like this function A LOT! Here is the example. What I made is to zoom in the 4 proteins and rotate them to proper view for comparison. The output image is ready for publication! (easy, isnt it?)

August 20, 2012

PyMOL on the iPad

Filed under: pymol/ molmol — kpwu @ 9:26 pm
Tags: ,

PyMOL mobile app for iPad released today as posted by PyMOL maintainer at PyMOL mailing list.

Please go to “http://pymol.org/mobile” to see details.

Or directly go iTunes store to download this App.


July 19, 2012

[Xplor-NIH] modified residues (protein)

Filed under: xplor/xplor-nih/cns — kpwu @ 1:02 am
Tags: , , ,

I searched the Xplor-NIH mailing list to know how many modified amino acids are supported in Xplor-NIH.

So far, I can see N-terminal acetylation and spin labeled (MTSL) cysteine are documented in the mailing list. I wonder to know if acetylated lysine, phosphorylated serine, threonine and methylation are also supported in Xplor-NIH.

Here is the example of N-terminal acetylation and MTSL-labeled cysteine:

code: ACE = N-terminal acetylation. Xplor-NIH set it as an individual residue
CYSP = spin labeled cysteine.

Steps to do:

  1.  edit your sequence file: (3-letter code, residues are separated by space), add ACE as the first residue and change the desire CYS to CSYP
  2. in typical xplor-nih anneal.py (see such example scripts in xplor-nih home/eginputs), around line 35-45, change to:
    # generate PSF data from sequence and initialize the correct parameters.
    #
    from psfGen import seqToPSF
    #seqToPSF(open(‘xyza.seq’).read())
    seqToPSF(“xyza.seq”, seqType=’prot’, startResid=0)

    –> The original script was marked off and a similar script was shown here. I also alter the number start residue to “0”.  That will be easier for me while doing NOESY assignment without shifting my residue numbers

  3. Then, run “xplor -py anneal.py” to check if the generated template PDB have correct residue numbers and the modified amino acids.

Here is the snapshot of my generated template PDB. (ACE as residue 0, CYSP as residue 2)

Next Page »

Create a free website or blog at WordPress.com.