My software notes

November 15, 2011

[PyMOL] gradient background color

Filed under: pymol/ molmol — kpwu @ 12:03 pm
Tags: ,

Starting at  PyMOL 1.4,  single color for the background is no longer the only choice. By using 3 PyMOL commands, the gradient background color can be easily shown. The only thing users have to know is that command “ray” doesn’t support this gradient color yet. So if you type “ray” in the pymol terminal , the gradient color will show off.

Here is what I did (use PyMOL 1.4) at get the following picture:

set bg_rgb_top, [0,255,0]
set bg_rgb_bottom, [0,255,255]
set bg_gradient, on
png gradient_bg.png 

November 12, 2011

[PyMOL] Sidechain helper in the cartoon view

Filed under: pymol/ molmol — kpwu @ 3:25 pm
Tags: , ,

Using cartoon view to present the protein secondary structures and tertiary structure is common and we also often see people present some sidechains of particular residues which may be important in some biological roles. In PyMOL, when sidechain atoms are presented in the “sticks mode” with the cartoon scaffold, we always see the backbone atoms (e.g. N, O) are also presented in the sticks mode.

Here is the example (PDB code: 2BTF) showing that the nitrogen (blue) of Val47 is displaying inside the helix.

By using a PyMOL commend “set cartoon_side_chain_helper”, we can quickly hide sticks of the nitrogen and oxygen atoms.

Command: set catoon_side_chain_helper, on 

note: “on” for removing the sticks, “off” (default argument) is to keep all atoms in sticks view


Note (11/14/2011): PyMOLWiki has an example page of this command, see here.


October 6, 2011

[PyMOL] assign secondary structural regions

Filed under: Uncategorized — kpwu @ 3:25 pm
Tags: , , ,


Sometimes I displayed the cartoon view of a protein in PyMOL as the figures shown below that I don’t really see the helix and strands.

It often happens when I merged 10 or 20 structures into a NMR ensemble file. All 20 structures are aligned but the secondary structural regions are not clearly displayed in PyMOL (commands: set all_states, on)

PyMOL provides two simple means to quickly draw helices and strands on the target proteins.

1. use command “dss”.

Simply type “dss” in the command line, PyMOL automatically calculates, rebuilds and draw the secondary structural regions. If the “all_states” is turned on, all structures will also be displayed properly. Here are two figures show the results of “dss” with single and all 20 states of my target protein.

The command “dss” provides simple but quick way to draw helical and strand regions, however, using other programs such as “DSSP” or “STRIDE” to clearly define the regions of helices and regions is highly recommended.

2. Use command “alter”

As I just said, “dss” doesn’t work perfectly. In this example case, I found length of first two sheets are not long enough, and the loop is a bit longer. I can use command “alter” to manually assign the secondary structural regions of my target proteins.

alter 3-9/, ss=’H’
alter 12-18/, ss=’H’
rebuild

The above 3 lines are the commands I typed in and the sheets are now longer (see the right up corner). To change the length of loop and sheets, just type alter xx-yy/, ss=’L’, and alter aa-bb/, ss=’S’, respectively.


October 5, 2011

[PyMOL] customized display of helices and strands

Filed under: pymol/ molmol — kpwu @ 11:43 am
Tags: , ,

The  default view of cartoon presentation in PyMOL is provided below.

PyMOL provides commands “cartoon_oval_length“, “cartoon_oval_width“, “cartoon_rect_length” and “cartoon_rect_width” to customize the display of helices and strands.

PyMOL users should be aware that the 4 commands can’t be combined with “cartoon_fancy_helices” and “cartoon_fancy_strands”.  Once the fancy mode is turned on, the manually customized width/length will be changed back to default number.

The first few examples will be related to the oval view

command: set cartoon_oval_length 0.2

command: set cartoon_oval_length 1

command: set cartoon_oval_length 1.7

We can also change the thickness of the helix in our target by using “cartoon_oval_width”

The figure below shows the default thickness of helix.

command: set cartoon_oval_width 0.8

command: set cartoon_oval_width 1.5

Now. let me show you some examples to change the width and thickness of strand by using PyMOL.

command: set cartoon_rect_length 0.3

command: set cartoon_rect_length 0.7

command: set cartoon_rect_length 2

command: set cartoon_rect_width 0.1

command: set cartoon_rect_width 0.9

command: set cartoon_rect_width 1.6

October 4, 2011

Some cartoon views of proteins shown in PyMOL

Filed under: pymol/ molmol — kpwu @ 6:56 pm
Tags: ,

Example of cartoon modes of protein shown by PyMOL

Example protein: 1UA8, LolA

By default, the cartoon mode in PyMOL shows protein structure like this way:

We can change the background to white by typing “bg_color white” in the command terminal and also change the color of protein based on types of secondary structures in the color options (the “C” button on the right side of this object).


The cartoon view of this protein shows red, yellow and green colors for helical , strand and coil regions respectively. However, the interior and exterior sides of helices and sheets have colors which doesn’t provide clear view. So one way in PyMOL to create the difference is called “highlight color”. I typed “set cartoon_highlight_color lightorange” to change the color of internal side of helices and side of strands.


When rotating the protein, the zoom-in view of helices shows the border of each helix is smooth. There are commands called “cartoon_fancy_helices” and ” cartoon_fancy_sheets” that provide fancy borders of the helices and strands.


By typing “set cartoon_fancy_helices, 1” and “set cartoon_fancy_sheets, 1” (1 is on, and 0 is off in PyMOL, always). The  cartoon of helices has different views:


Another way to present helices is the old fashion cylindrical/rod view by typing “set cartoon_cylindrical_helices, 1“.

One more example to show is the “discrete color”! You may find that residues in the loop regions sometimes colored in yellow or red (not green) when connected to strands or helices. The mode of discrete color is turned off at this moment. The following two figures present activated and inactivated mode of “discrete color”. Personally, I like to turn on the discrete color mode all the time.

ON mode (set cartoon_discrete_colors, 1)

OFF mode (set cartoon_discrete_colors, 0)

July 28, 2011

[PyMOL] DNA–example II

Filed under: pymol/ molmol — kpwu @ 6:09 pm
Tags: ,

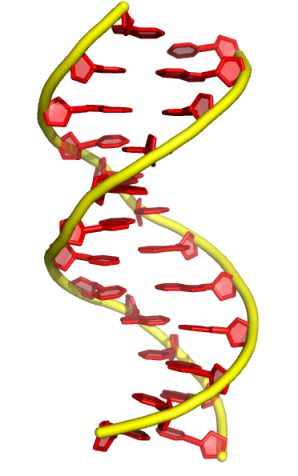
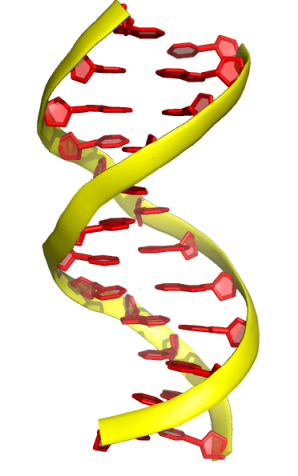
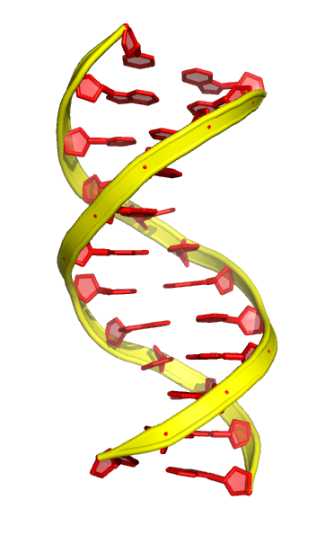
Follow up previous post, here shows several modes available in PyMOL to display the ribbon/chain of DNA/RNA.

Example molecule: B-form DNA PDB code:  2L8Q

Running version, PyMOL 1.3 (x11 version on MacOS 10.6)

The previous version use “oval” to show the ribbon of DNA. Here are some other ways to show the ribbon:

1. default ribbon shown by cartoon (“tube” mode)
default radius of tube mode

set cartoon_tube_radius, 1

2.  The  “oval” mode

cartoon oval
set cartoon_oval_width, 0.3
set cartoon_oval_length, 1.2

3. The “rect” mode:

cartoon rect
set cartoon rect_width, 0.5
set cartoon rect_length, 2

combined with addition command (molecule rotated):

cartoon arrow

4. The “dumbbell” mode:

cartoon dumbbell,
set cartoon_dumbbell_width, 0.3
set cartoon_dumbbell_length, 1
set cartoon_dumbbell_radius, 0.35

In most protein structures shown in papers, the helices and sheets are always colored in two colors. We can use “cartoon_highlight_color” to create such effect on DNA,too. Here is the example:

set cartoon_highlight_color, navy
set cartoon_nucleic_acid_color, palecyan

2012 May 24, new post about different colors for the rings.

July 26, 2011

[PyMOL] example of DNA

Filed under: pymol/ molmol — kpwu @ 4:41 pm
Tags: ,

Several private emails request me to show some examples of DNA/RNA using PyMOL. I am not familiar with commands related to nucleic acids in PyMOL because I never have chance to study DNA/RNA. I made some posts few years ago just for fun.

Here is a step-by-step re-cap I make followed by my old post.

PyMOL: 1.3 on Mac OS 10.6.5

DNA template: PDB code 2L8Q

beginning point: using “default cartoon” to show the duplex B-form DNA

set cartoon_nucleic_acid_color, yellow
cartoon oval

set cartoon_ring_mode, 1
set cartoon_nucleic_acid_mode, 0
set cartoon_ring_color, red
set cartoon_ring_transparency, 0.5

set cartoon_oval_length, 1.6
set cartoon_oval_width, 0.8
set cartoon_ring_width, 0.5

set ray_trace_fog,0
ray

set ray_trace_fog, 1
set ray_trace_mode,2
ray

turn on “surface”
set surface_color, white
set transparency, 0.35

Differences of “cartoon_nucleic_acid_mode” are shown at here.

July 9, 2011

[PyMOL] use of “ray_trace_mode”

Filed under: pymol/ molmol — kpwu @ 9:20 pm
Tags: , ,

I do like a command called “ray_trace_mode” in PyMOL because different modes can generate different light and color effects on the structure I want to express to readers/students. Here is a quick examples of the effect on different modes.

The structure I use at here is LolA which PDB code is 1UA8.

1. ray_trace_mode 0 ( at pymol terminal, type “set ray_trace_mode 0”)

2. ray_trace_mode 1 ( at pymol terminal, type “set ray_trace_mode 1”)

3. ray_trace_mode 2 ( at pymol terminal, type “set ray_trace_mode 2”)

4. ray_trace_mode 3 ( at pymol terminal, type “set ray_trace_mode 3”)

5. ray_trace_mode 4 ( at pymol terminal, type “set ray_trace_mode 4”)

April 12, 2011

PyMOL-electrostaic surface view

Filed under: pymol/ molmol,softwares and scripts — kpwu @ 8:04 pm
Tags: , ,

To make electrostatic surface view of protein using PyMOL, two ways are often suggest. One option is using ABPS to generate the electrostatic map. Here is one nice instruction at PyMOLwiki using ABPS. Another option is using Delphi developed by Barry Honig group to generate the electrostatic map of protein.

I am writing a note at here using Delphi to generate electrostatic surface map of proteins in PyMOL as I learned from one online howto.

  1. download Delphi and uncompress it.
  2. edit the delphi.param.
    Basically, just need to replace the filename of the PDB you are going use.
  3. run “$PATH/delphi $PATH/delphi.param.
    The default name of output is fort.20 and I rename it to “xxx.phi”
  4. In PyMOL, load the protein first. Assume the object name of loaded protein is “new_protein”. Show the surface and remove all other shows (lines as default, or cartoon..)
  5. At PyMOL command terminal, type:
    load xxx.phi, emap
    (The emap object is then created).
  6. type: ramp_new elvl, emap, [-2,0,2] to create an object of the electrostatic level with a rang of -2 (red) to 0 (white) and to 2 (blue). The range can be changed. E.g. [-7, 0, 7].
  7. type: set surface_color, elvl, new_protein

Here is the example I have using my project protein:

Note:

  • I have tried Delphi on my iMac and on a Linux cluster. Although I used same delphi.param, delphi can’t successfully calculate the electrostatic map for me on iMac.
  • I saw people use ABPS+PyMOL to make electrostatic surface views for TWO proteins in ONE PyMOL window. I tried doing similar thing using the steps I noted at here, not successful to show two different electrostatic views for two proteins (I generated two maps separately).

April 8, 2011

PyMOL–making movies

Filed under: pymol/ molmol — kpwu @ 1:31 pm
Tags: ,

I found several good online tutorials of making movies using PyMOL and provide the links at here.  I should make some examples by my own next time.

« Previous PageNext Page »

Blog at WordPress.com.