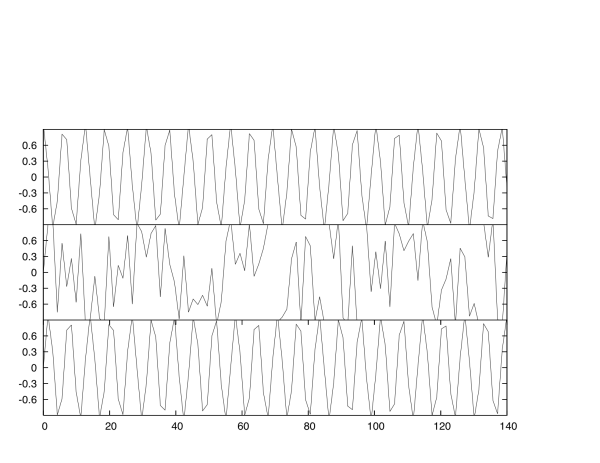
Here is an example I made to generate a multiple plots by gnuplot. I don’t want that the 3 plots have space in between the x-axis. So the trick thing is: set the margin (r, l, t,b) very smaller,e.g. 0.01. Then the output looks “like” 3 stacked plots. You can modify it by 3 connected plots in a row (left, middle, right).
The plot is shown here:
The scripts is pasting here:
=========================
set terminal postscript
set output “data.ps”
unset key
NX=1; NY=3
DX=0.01; DY=0.01; SX=0.85; SY=0.25
set bmargin DX; set tmargin DX; set lmargin DY; set rmargin DY
## set the margin of each side of a plot as small as possible
## to connect each plot without space
set size SX*NX+DX*1.5,SY*NY+DY*1.8
set multiplot
##—— First Figure–bottom
set size SX,SY
set xrange [0:140]
set yrange [-0.9:0.9]
set ytic -0.6,0.3,0.6 ### from -0.6 to 0.6 with 0.3 interval
set origin DX,DY;
plot sin(x)
###——Second Figure—middle
set origin DX,DY+SY;
unset xtics
plot sin(x**2)
##——- Third Figure—-top
set origin DX,DY+SY*2
plot cos(x)
unset multiplot

[…] gnuplot By maldacena https://kpwu.wordpress.com/2007/11/20/gnuplot-make-a-multiplot-3-stacked-plots/ […]
Pingback by gnuplot « A Second Life — January 25, 2009 @ 10:34 pm |
This is a nice script. If I want to include the x label and ylabel what else should I include?
Comment by prakash — March 3, 2009 @ 4:10 am |
just add the lines in proper places.
e.g.
set xlabel time
set ylabel intensity
Comment by kpwu — March 3, 2009 @ 8:12 am |
Good ! What if I wish to also place a ylabel. The stack of three plots becomes a complete mess. I have tried offset etc. and the mess gets worse. Any solution ?
– Atish .
Comment by Atish — March 26, 2009 @ 12:45 pm |
Sorted out with ‘set lmargin’. Thanks !
Comment by Atish — March 26, 2009 @ 12:51 pm |
Meanwhile, gnuplot supports automatic layout for stacked plots.
See the demo (scroll to bottom):
http://gnuplot.sourceforge.net/demo_4.3/layout.html
Comment by Walter — July 27, 2009 @ 9:28 am |
I want to add xtics at different plot in the stack.
What have to do?
Thanks
K.S.
Comment by Kanchan Sarkar — July 17, 2010 @ 4:41 pm |
Again How can one add title to different plots in the stack?
Comment by Kanchan Sarkar — July 17, 2010 @ 4:52 pm |
I got answers.
Comment by Kanchan Sarkar — July 17, 2010 @ 5:54 pm |
Hi,
Thank you for the example. I have a question about it. The output that I get doesn’t look like the one you provided. Do you know what the problem might be?
Thanks!
Comment by randaasad — July 20, 2011 @ 12:22 am |
perhaps it’s about the version of GnuPlot. The script shown at here was created 4 years ago. I may use GnuPlot 3.5 at that time. I was having lots of problem using my old scripts for GnuPlot 4.0 and above.
Comment by kpwu — July 20, 2011 @ 1:00 am |
Hi, I am trying to do vertically stacked plots with 5 graph. I totally mimic your post. But 4 of them is appear. one is out of range. Here is my code. Could you help me find solution?
set key bottom center
NX=5; NY=1
DX=0.01; DY=0.01; SX=0.25; SY=0.85
set bmargin DX; set tmargin DX; set lmargin DY; set rmargin DY
set size SX*NX+DX*4,SY*NY+DY*4
set multiplot layout 1,5 #title ‘Distance from inlet boundary’ font #’areal,18′
#1set title ‘sa4(210)’
set size SX,SY
set label 1 ’50m’ at 1.5, 1.5 #font ‘areal,15’
set x2tics (0, 0.01, 0.02)
set xtics (0, 2, 4)
set ytics (-15, -10, -5, 0)
set x2range [-0.001:0.02]
set xrange [0:4]
set yrange [-15:0]
set ylabel ‘metre(s) below sea level’
set key bottom
set xtics nomirror #smooth bezier w p csplines
set origin DX,DY;
plot ‘so10.dat’ u 2:1 w p pt 7 lc rgb ‘red’ title ‘Salinity’ axes x2y1,\
‘so10.dat’ u 3:1 w p pt 8 lc rgb ‘blue’ title ‘Sediment’ axes x1y1
#2set title ‘sa4(210)’
set size SX,SY
set label 1 ‘250m’ at 1.5, 1.5 #font ‘areal,15’
set x2tics (0, 0.01, 0.02)
set xtics (0, 2, 4)
set x2tics
set x2range [-0.001:0.02]
set xrange [0:4]
unset ylabel
unset ytics
set key bottom
set xtics nomirror #smooth bezier w p csplines
set origin DX+SX,DY;
plot ‘so50.dat’ u 2:1 w p pt 7 lc rgb ‘red’ title ‘Salinity’ axes x2y1,\
‘so50.dat’ u 3:1 w p pt 8 lc rgb ‘blue’ title ‘Sediment’ axes x1y1
#3set title ‘sa4(210)’
set size SX,SY
set label 1 ‘750m’ at 4.0, 1.5 #font ‘,15’
set x2tics (0, 0.01, 0.02)
set xtics (0, 5, 10)
set x2tics
set x2range [-0.001:0.02]
set xrange [0:10]
unset ylabel
set key bottom
set xtics nomirror #smooth bezier w p csplines
set origin DX+SX*2,DY;
plot ‘so150.dat’ u 2:1 w p pt 7 lc rgb ‘red’ title ‘Salinity’ axes x2y1,\
‘so150.dat’ u 3:1 w p pt 8 lc rgb ‘blue’ title ‘Sediment’ axes x1y1
#4set title ‘sa4(210)’
set size SX,SY
set label 1 ‘850m’ at 4.0, 1.5 #font ‘,15’
set x2tics (0, 0.01, 0.02)
set xtics (0, 6, 12)
set x2tics
set x2range [-0.001:0.02]
set xrange [0:12]
unset ylabel
set key bottom
set xtics nomirror #smooth bezier w p csplines
set origin DX+SX*3,DY;
plot ‘so170.dat’ u 2:1 w p pt 7 lc rgb ‘red’ title ‘Salinity’ axes x2y1,\
‘so170.dat’ u 3:1 w p pt 8 lc rgb ‘blue’ title ‘Sediment’ axes x1y1
#5set title ‘sa4(210)’
set size SX,SY
set label 1 ‘950m’ at 4.0, 1.5 #font ‘,15’
set x2tics (0, 0.01, 0.02)
set xtics (0, 5, 10)
set x2tics
set x2range [-0.001:0.02]
set xrange [0:10]
unset ylabel
set key bottom
set xtics nomirror #smooth bezier w p csplines
set origin DX+SX*4,DY;
plot ‘so190.dat’ u 2:1 w p pt 7 lc rgb ‘red’ title ‘Salinity’ axes x2y1,\
‘so190.dat’ u 3:1 w p pt 8 lc rgb ‘blue’ title ‘Sediment’ axes x1y1
unset multiplot
Comment by Ayurzana — March 8, 2016 @ 2:43 am |